IDEX Online Research: U.S. Gold Jewelry Sales Rise 4% in 2005
July 16, 06
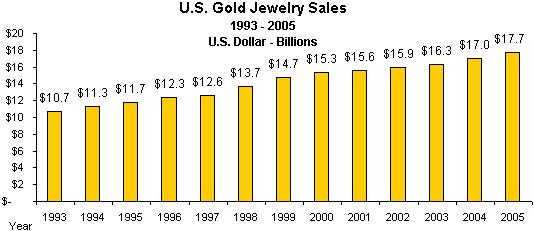
Gold jewelry sales in the U.S. market were about $17.7 billion in 2005, according to the World Gold Council, an increase of 4.4 percent over the prior year. This is slightly greater than the 3.8 percent increase for all U.S. jewelry sales, and it indicates that gold jewelry gained market share.
The graph below summarizes annual gold jewelry sales in the U.S. since 1993.
|
|
Gold jewelry sales statistics include all classes of men’s and women’s jewelry where the primary value is gold content, including gemstone jewelry. However, uncounted are gold mounts used for diamond jewelry and other classes of jewelry where gold is not the primary value.
While sales figures are not available for all categories of jewelry, IDEX Online Research believes that gold jewelry likely took market share from platinum jewelry.
Gold Jewelry Is Major Portion of U.S. Market
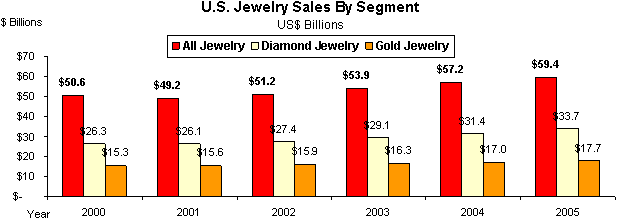
The graph below summarizes sales by market segment by gold jewelry, diamond jewelry, and total jewelry. Because these figures are derived from different sources, and because of definitional differences, it would appear that gold and diamond jewelry represent most of the U.S. jewelry market. However, there is overlap between these two categories; further, the figures were furnished by trade associations that represent each of these categories.
|
|
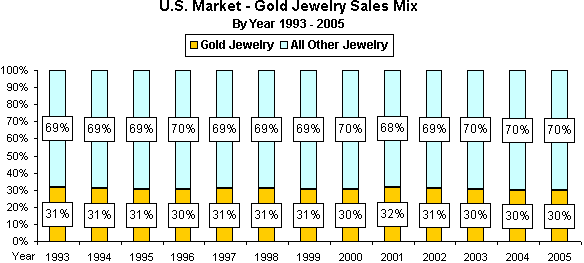
Despite small differences in demand on an annual basis between gold jewelry and total jewelry, the total gold jewelry sales mix in the U.S. market has remained remarkably stable at around 30 percent-31 percent since the early 1990s, as the graph below illustrates.
|
|
Demand for Gold Jewelry Follows Demand for All Jewelry
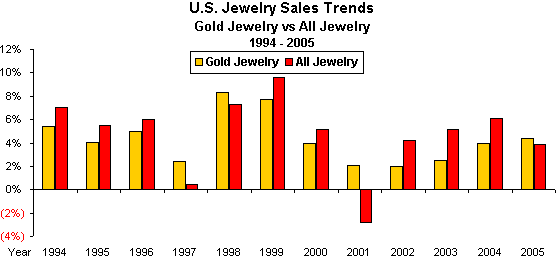
In general, when demand is strong for all jewelry, consumers step up their purchase of gold jewelry. When demand for all jewelry falters, gold jewelry usually suffers, too. However, in 2001, consumers increased their demand for gold jewelry. In part, this was a reaction to the events of September 11; consumers began to move some of their assets into gold as a safe harbor to hedge against potential volatile currency swings.
|
|
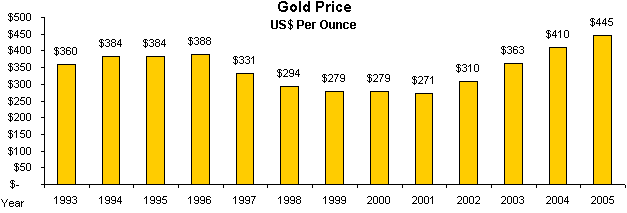
While jewelry should not be touted as “an investment,” those consumers who purchased gold and gold jewelry in 2001 bought it at the bottom of the current price cycle, as the graph below illustrates.
|
|
Gold Jewelry Prices Do Not Follow Gold Price Swings
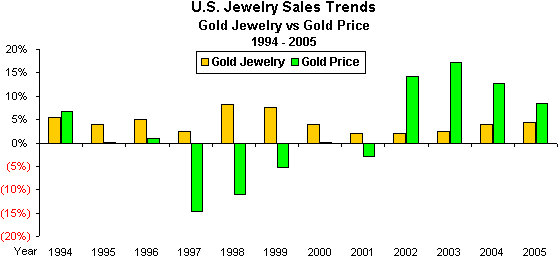
However, it is important to note that gold jewelry sales do not typically follow gold price swings. The graph below compares changes in the price of gold versus changes in demand for gold jewelry in the U.S. market. Gold prices have shown volatile swings (green bars) while demand for gold jewelry has been much more consistent and stable.
Source: World Gold Council
U.S. gold jewelry sales growth in 1994 was slightly below the increase in gold prices
