IDEX Online Research: The Ever-Changing Face of the American Jewelry Consumer
August 08, 07
The old adage, “the only constant is change,” applies to the American jewelry consumer. Just as soon as marketers think they’ve figured out which consumers have the greatest propensity to buy jewelry, new market research comes along to prove that the old market research is out-of-date.
What is behind this ever-changing face of the American jewelry consumer? The short answer is this: American shoppers are fickle.
New Data Confirms Shoppers’ Fickleness
The U.S. Bureau of Labor Statistics (BLS) recently released their annual Consumer Expenditure Survey (CES), and it contains detailed statistics about American’s spending habits, and it confirms that American shoppers are fickle. Spending trends not only change annually, but also they vary on a quarterly basis, according to the BLS’ CES.
Want to know how much people spend for peanut butter each year? It’s in the survey. Data about every conceivable expenditure, right down to the final penny, is available in the CES, including detailed spending data on jewelry and watch sales, jewelry gift spending, jewelry repair spending and other detailed spending information.
In addition to the usual annual demographic profiles of the American jewelry shopper, new data is available on the number of U.S. households that actually purchase jewelry (about one-in-four), how much the typical jewelry shopper spends in a year (very close to $2,000), and an estimate of the number of shopping trips in a year during which a jewelry purchase is made (it depends on who the consumer is).
There is a major caveat to all of this consumer demographic and spending data: it represents a mathematical average. Averages can be deceiving. For example, the average age of the typical American consumer in 2005 was 48.6 years. That average was calculated by averaging the ages of all 300 million American consumers; it really is meaningless. However, when researchers drill down into detailed statistics, the “averages” become much more meaningful, because they are looking at a small segment of consumers.
New Consumer Spending Research Confirms Changes
The U.S. Bureau of Labor Statistics (BLS) recently released detailed research about consumer spending patterns for 2005, and their findings confirm that spending by consumers on jewelry has changed again. Some multi-year trends were shattered, while others seem to have stood the test of time.
Each year, the BLS conducts a highly detailed Consumer Expenditure Survey. Consumers are given diaries and asked to account for every penny of their spending every day for two consecutive weeks. In addition, five interviews with consumers are conducted at three-month intervals. Between the detailed diaries and the interviews, the BLS survey overlooks virtually nothing.
What were the big changes in jewelry demographics?
- Spending on jewelry by age shifted substantially, confirming our thesis that age is not a good predictor of jewelry consumption.
- Spending on jewelry by U.S. region shifted substantially, with the South posting a strong spending increase.
- Spending on jewelry as a gift declined sharply.
- Jewelry’s share of wallet fell modestly in 2005.
Highlights of American Jewelry Consumers
Here are some of the key highlights gleaned from the BLS 2005 Consumer Expenditure Survey for jewelry shoppers.
- Household Jewelry Spending $502 – In 2005, the typical American household spent $502 on jewelry, up 3.3 percent from 2004’s $486 (revised). The number of U.S. households rose by about 1 percent to 117.4 million in 2005 versus 2004. This drove total jewelry sales in 2005 to $58.9 billion, up 4.3 percent from 2004.
- Boomers Are Back – After cutting back on their jewelry expenditures for four years, consumers age 45-54 stepped up their jewelry spending solidly in 2005; these households spent about $642 on jewelry in 2005, well above the average of $502 for all households. There were significant other shifts in jewelry spending by age group. The bottom line: age is not a good predictor of jewelry expenditures. Logic suggests that all those wealthy Baby Boomers will spend heavily on luxury goods, including jewelry, now that their debt levels have declined, their children have left home and their income is higher than ever. However, for the four-year period 2001-2004, Boomers defied this logic. They did not return to their historical robust spending on jewelry until 2005.
- Only about one-in-four households buys jewelry during the year – New data suggests that less than 25 percent of all American households shop for jewelry in a 12-month period. However, their spending is a robust $2,000 per year, though we caution that this is an average with a very wide range. Further, it appears that the typical jewelry customer visits their favorite jewelry store less than three times per year, though this is an average with a wide range of variety.
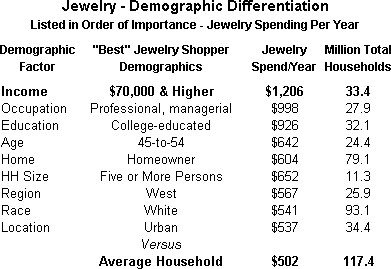
- High Income Consumers Love Jewelry – Higher income consumers spend exponentially more on jewelry than lower income consumers. The average household earning $70,000 and above spent $1,206 on jewelry in 2005, about 2.4 times the amount of the average household. Why? High-income consumers have dramatically more discretionary income. This trend has been solidly in place for many years, and data from the 2005 Consumer Expenditure Survey reconfirms this trend.
- White Collar Professional Workers Spend Heavily on Jewelry – In 2005, the typical household headed by a professional spent $998 on jewelry, nearly double the national household average. This is in line with 2004 data. White collar workers tend to have higher incomes.
- Ethnicity Matters, But Not Much – White consumers typically spend much more on jewelry than any other race or ethnic group. This long term trend was reconfirmed in 2005 when consumers in a white household spent $541 on jewelry, less than 10 percent above the average household spend of $502.
- Household Size Is A Predictor of Jewelry Demand – Smaller households (two people) and large households (five or more) are the largest jewelry spenders. Households with five-or-more consumers spent $652 on jewelry in 2005; two-person households spent an average of $584. All other size households spent significantly less than two-person and five-person households. This trend is unchanged from prior years.
- Urban Consumers Spend Slightly More on Jewelry – It’s a social thing: when population density increases, jewelry spending rises. This year, however, central city consumers spent slightly more – $537 – per household than their suburban counterparts. We believe this trend is related to a return to city living by older, wealthy empty-nesters. Further, suburban consumers – nuevo-rich – tend to carry much more debt and have less discretionary income. Rural shoppers spent the least on jewelry of all groups.
- Homeowners Are Best – When consumers feel wealthy, they spend on jewelry. Homeownership builds consumer wealth. The typical home-owning American spent $604 on jewelry in 2005, about 20 percent above the spending of the average household. This trend is similar to prior years’ results.
- Regional Shifts in Spending – In 2005, there were some significant shifts in regional spending on jewelry. Consumers in the West, South and Midwest spent the most; consumers in the Northeast spent well below average. In prior years, Southerners lagged, while jewelry spending by Northeasterners was near the average. While the BLS reports regional spending, we do not believe it is meaningful for two reasons: 1) the regions are too large to be of significance; and 2) there is not enough difference between regional expenditures to be meaningful.
- Better-Educated Shoppers Spend More – Education and income levels typically correlate closely. College-educated consumers spent $926 on jewelry in 2005, nearly double the national average. High-school educated consumers spend the least; post-college educated consumers tend to spend the most on jewelry.
- Spending for Jewelry As A Gift Plummeted in 2005 – This was a shocking statistic: Americans spent significantly less – 20 percent less – on jewelry as a gift in 2005 than in 2004. In 2005, spending on jewelry as a gift was 11.5 percent of total jewelry expenditures; in 2004, it was 14.9 percent of total jewelry expenditures. Two groups – consumers aged 25-34 and consumers aged 55-64 – spent significantly less in 2005 than 2004. Most other consumer age groups spent about the same in both years.
- Jewelry’s Share of Wallet Decreased Again – As a percentage of total consumer spending, jewelry declined modestly in 2005, a trend which has been ongoing since the middle of the last decade. In 2005, jewelry spending represented about 0.86 percent of all shoppers’ spending, down from 0.89 percent in 2004 and down from nearly 1.00 percent in 2003.
Best Jewelry Shopper
Based on the latest data from the Consumer Expenditure Survey, the following table summarizes the “best” American jewelry shopper. Key demographic factors are listed in order of importance. For example, consumer households with an annual income of $70,000 or higher spend $1,206 annually on jewelry; that’s 2.4 times the amount spent – $502 – by the average household.

Source: U.S. Dept. of Commerce
The bottom line analysis of these demographic characteristics, including those which have changed and those which have not changed, is that our long term jewelry forecast for above average sales gains remains intact. We continue to believe that jewelry sales will grow by at least 5 percent annually between now and 2025, somewhat above the average growth forecast for all retail categories of about 4.5 percent.
The Typical American Household: Virtually Unchanged, Except for Income
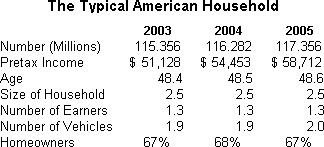
The following table summarizes the key demographic characteristics of the average American household. Aside from a consistent increase in income – up nearly 15 percent in two years – the only other notable changes are the age of the head of the household and the number of vehicles. The aging of households is due to the bubble of Baby Boomers who are getting older. The number of vehicles has to do with American’s love affair with their automobiles.
 Source: BLS |