IDEX Online Research: U.S. Jewelry Sales Numbers for July Divergent; Revisions Likely
September 23, 08
U.S. jewelry sales have been weak this year. After posting gains averaging at least 5 percent over the past several years, jewelry sales increases have been in the +3 percent range in 2008.
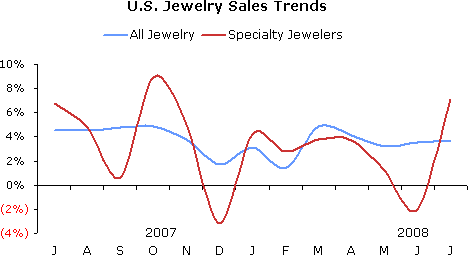
But for the second time this year, the U.S. government has published highly divergent jewelry industry sales figures. According to the Department of Commerce, specialty jewelers’ sales declined by 2 percent in June – a semi-credible number, though weaker than our sample showed – but rocketed by 7 percent in July, a number that simply isn’t credible, in our opinion.
The Bureau of Economic Analysis, which tracks total consumer spending for jewelry, has shown modestly accelerating growth for the past three months of May, June and July: +3.2 percent, +3.5 percent, and +3.6 percent respectively. These numbers are believable, and they track with our own small research sample.
Our conclusion is that the Department of Commerce numbers for specialty jewelers will likely be revised – hopefully significantly – and will show a more credible modest gain, fueled totally by inflationary pricing at the retail level. This scenario is reality, in our opinion.
The table below summarizes jewelry sales for specialty jewelers, total retail jewelry sales at all merchants (discounters, mass market retailers, specialty jewelers, online merchants, etc.), and total retail sales (including all categories), as published by the U.S. Government. The disparity and divergence between the July sales trends is clearly evident on this table. We’ve also highlighted the divergence in the June numbers, though they have some credibility.
 Source: Various |
When the jewelry sales numbers are dissected and analyzed, two trends are immediately uncovered:
- Jewelry retail price inflation is running at a rate in excess of 8 percent annually. Thus, jewelry unit sales are down by 4-5 percent. This is a major departure from historic inflation levels which were almost non-existent or, in some years, deflationary (retail prices dropped).
- Jewelry sales trends vary widely by position in the industry: higher-end jewelers are generally posting stronger gains than mass market jewelers. Lower-end jewelers are posting reasonable numbers simply because consumers are “shopping down” – that is, they are seeking value-priced goods. Zale is the best illustration of this concept: 20 percent of its sales came from liquidation merchandise in the second quarter, with gross margins in the 20 percent range, in our opinion. Shoppers snapped up those bargains in part because they were value-priced, but also in part because the retail price points were very low.
Why have jewelry sales been weaker than normal? A longer term view reveals that the jewelry industry has been buffeted by headwinds from at least seven major factors, including the following:
- The U.S. economy has softened.
- The housing market is weak, with home prices down in most markets.
- Credit availability has tightened; homes are no longer an ATM machine for consumers.
- Soaring energy prices – especially gasoline prices – have eaten into shoppers’ discretionary spending.
- Uncertain and volatile financial markets have taken their toll on consumers’ wealth levels.
- The uncertainty of the upcoming presidential election has created inertia among many consumers.
- A growing green movement has impeded demand for bling.
Only one of these “headwind” factors has a clear expiration date: the presidential election will be resolved in early November. History has shown that those associated with the losing party don’t stay in a funk very long, so it should be safe to take that factor off the list of headwinds late this year.
Jewelry Sales Forecast Remains Unchanged
Our jewelry sales forecast for the U.S. market in 2008 remains unchanged at about +3 percent. After seven months, total jewelry sales are up 3.4 percent, while specialty jewelers’ sales are up 2.8 percent. We believe that economic conditions in the second half won’t get significantly worse, and could improve. While many doomsday-sayers are predicting the worse, they forget three key factors: 1) the U.S. economy is more resilient today than ever before; 2) we have many checks and balances in place to keep the economy from free-falling into an abyss; and, 3) we’ve learned a thing or two about how to fix a troubled economy.
July Jewelry Sales Continue to Show Moderate Gains
The total market for jewelry in the U.S. grew by 3.6 percent rate during June, about in line with the year-to-date average of +3.4 percent. That’s not a bad, considering that there is no major sales event driving demand during the month. According to the Department of Commerce, specialty jewelers posted a dramatic sales gain of 7.1 percent for the month. We think that number will be revised significantly downward over the next few months (the government revises numbers monthly for 5-6 months, then revises them about a year later, and finally, it published major revisions about every five years).
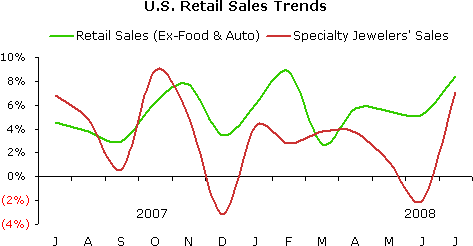
However, the jewelry industry lost a little market share when compared to all retail categories, though the difference between the jewelry sales gain – +3.6 percent – and the total retail sales gain –+4.0 percent – is almost statistically insignificant. Total retail sales, excluding food and automobiles, rose by an astounding 8.4 percent in July; this number will likely be revised significantly downward. While we look for downward revisions in the Commerce Department numbers, there will likely be little change directionally. Thus, when compared to most retail categories, the jewelry industry lost some modest market share during the month; this usually occurs in a period of economic weakness, so there is no reason for alarm.
The graph below compares specialty jewelers’ sales trends (red line) to total jewelry sales trends (blue line) in the U.S. market. As the graph clearly illustrates, jewelry sales at specialty jewelers have been on a roller coaster ride for the past few months, with a sharp slide in September, a spike in October, another slide in November and December, followed by a modest recovery in January, a small dip in February, and a modest recovery in March and April. In May, jewelry sales gains weakened substantially, followed by a major drop in June and a spike upward in July.

Source: US Dept of Commerce
The graph below summarizes sales trends for all retail goods (green line) excluding food and automobiles versus specialty jewelers’ sales (red line). When food and auto sales are excluded, the remaining retail categories posted a sales gain of 8.4 percent in July. When food and auto sales are included, retail sales were up 4.0 percent for the month, as previously indicated.
Why do we eliminate “automobile” sales? Monthly auto sales are driven largely by consumer incentives rather than by underlying economic factors. Over the long term, auto demand trends are an important indicator of consumer vitality; however, on a month-to-month basis, auto demand is dependent on manufacturers’ incentives such as zero percent financing, cash-back offers and other deals. Food sales are far less cyclical and can mask changes in consumer demand; thus, we eliminate them, too.

Source: US Dept of Commerce
Consumer Spending Was Up Slightly in June
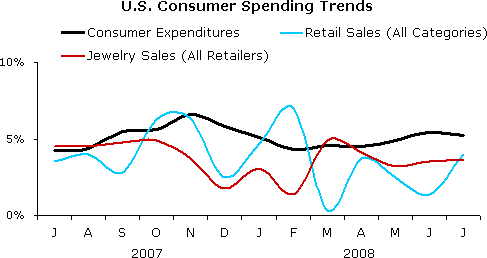
Driven by price inflation of core commodities such as gasoline and food, consumer expenditures rose by 5.2 percent during July 2008, down slightly from June’s +5.4 percent (revised). Further, the government numbers have been revised for the first seven months of the year; they show a different – and more hopeful – trend from prior months. Spending on services remains more-or-less on track, with little monthly deviation.
The graph below summarizes trends in American’s total spending (black line), retail sales of all goods (blue line) and expenditures on jewelry (red line). It is clear that dismal automobile sales in the U.S. market are having a dramatic negative impact on total retail sales (blue line). Automobile sales in 2007 were just over 20 percent of total retail sales; thus, it is clear why they have such an impact on total retail sales trends. And, it should be obvious why we typically eliminate them, when we analyze U.S. retail sales. Automobile sales are driven largely by the “deal-of-the-day,” as we noted above.

Source: US Dept of Commerce
2008 Jewelry Sales Forecast Unchanged
The economy is not technically in a recession – we’ve had only one quarter (ended December 2007) which showed a dip in GDP followed by anemic first and second quarter economic growth – but consumers are in a mental recession. As a result, jewelry demand has been soft. Consumer confidence has been bouncing around, but it does not correlate with retail sales or jewelry demand; if anything, it is a contra-indicator. The old adage about American shoppers – “when the going gets tough, the tough go shopping” – illustrates why Consumer Confidence and consumer demand do not correlate. In short, don’t be bothered by the excitable news commentators talking about Consumer Confidence; it means very little to the retail industry.
Primarily because of inflationary pressures, our jewelry sales forecast for the U.S. calls for a +3 percent gain for 2008. There is one important note: all jewelers are expected to sell fewer pieces of jewelry (if inflation remains in the 8-9 percent range, it means that unit sales of jewelry will be down 5 percent or so); further, we are assuming that the average ticket won’t move much.