IDEX Online Research: Zale Posts Second Consecutive Quarter of Improvement
June 22, 11(IDEX Online) – If two quarters of improvement constitutes a trend, then Zale is on the come-back trail.
The Positives
Zale’s same-store sales rose by over 14% in the quarter ended April 2011, following a 7% increase in the quarter ended January 2011. That’s good news, especially since it comes on the heels of five consecutive quarters of negative same-store sales comparisons.
Here’s better news: the loss in the April 2011 quarter was about 25% smaller than the loss in last year’s April period. That also follows the Christmas 2010 quarter (ended January 2011) in which the company posted a profit about four times as large as the prior year.
So, with same-store sales up markedly and earnings showing positive trends, there’s one more piece of good news: while Zale’s store count is down by 3%, total revenues were up nearly 15%. Clearly, the company’s per-store productivity is showing solid gains.
There are also qualitative signs that the company is doing better: it has more associates who have been trained to sell diamonds using the Diamond Council of America’s training package, and merchandise in the store looks good. Management turnover seems to have stabilized.
We sense that management is approaching the business more methodically, rather than haphazardly. The company is quick to close under-performing stores, and it opens new units only if the site meets stringent requirements. Further, it is testing retail price increases category by category, rather than simply imposing higher prices across the board.
The Negatives
That doesn’t mean Zale is totally “out of the woods,” as the expression goes. The company has added significant debt to its balance sheet, and inventory per store is up by 12%. As a banker, we’re a bit uncomfortable with this trend. As a merchant, it means that Zale has plenty of new merchandise in its stores to entice shoppers.
Further, Zale’s cash flow from operations – by our calculations – is still running negative, despite an increase in its cash balance year-over-year.
The Bottom Line: Cautiously Optimistic
The bottom line: we’re impressed, but we aren’t quite ready to declare victory.
April Quarter Results Encouraging
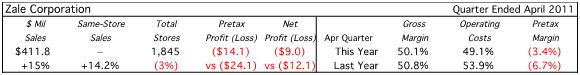
The table below summarizes the company’s key financial results for the quarter ended April 2011.
 |
Zale’s April Quarter Highlights
The following are financial highlights from the three-month period ended April 2011.
· Zale’s total revenues were $411.8 million, up nearly 15% from the prior year. Its quarterly operating loss from continuing operations, prior to interest charges, was $5.4 million, down dramatically from the quarterly loss of $24.7 million which the company posted last year.
| Division | $ Millions Revenues | Percent Change Y/Y |
| Fine Jewelry | $347.1 | +16% |
| U.S. Fine Jewelry | $285.5 | +14% |
| Canada Fine Jewelry | $61.6 | +21% |
| Kiosks | $61.4 | +9% |
| Other (Mostly Insurance) | $3.3 | +10% |
| TOTAL | $411.8 | +15% |
· Based on a reported same-store sales gain of 15.2%, which includes a benefit from currency translation (+14.2% constant currency, prior to a 6% increase in the Canadian dollar versus the U.S. dollar), Zales’ sales gain was driven by a 14.2% increase in the number of customer transactions and a 2.3% increase in the average transaction value in the fine jewelry stores.
· Zale management noted that several jewelry categories began to show positive sales comparisons in the quarter, including diamond fashion, color, metals and watches. Earlier, the company’s primary focus was bridal, which has been fueling sales gains for at least two or more quarters.
Warranty revenue also helped boost sales, perhaps by as much as one percentage point of the same-store sales gain. Warranty revenue is shown on the table above in the “Other” category.
· Same-store sales gains accelerated during the quarter. Early in the quarter, management noted that they were running at a low double-digit digit level. By later in the quarter, they were running at mid-to-high double-digit levels.
· For the first ten days of May – including the important Mother’s Day selling period – same-store sales were running up by about 10%.
· Zale’s credit business seems to be showing improvement. While it appears that Zale’s credit sales fell slightly as a percentage of total sales, approval rates were up 2%, and the average credit sale was up by about 5%.
· Zale’s gross margin fell to 50.1% in the quarter from the prior year’s 50.8%. Most of the decline (160 basis points) was due to higher cost of merchandise and a shift in sales mix to lower margin merchandise. This was offset by a 90 basis point improvement in inventory impairment charges and increased revenues related to warranty sales.
· Operating costs declined to 49.1% of revenues from last year’s 53.9% due to leverage of fixed costs as well as a decrease in professional fees and severance costs. Store performance-based compensation rose, and promotional costs related to Valentine’s Day were higher.
· Zale’s balance sheet shows increased per-store inventory levels – up roughly 12% from last year. Management said that about one-third of this increase is due to higher commodity costs, one-third is related to more merchandise to fuel the current level of sales activity, and one-third due to a combination of currency translation (inventory in the Canadian stores) and a lower inventory reserve valuation for possible discontinued products.
· When all of these financial factors are taken into account, Zale’s operating profits by division are shown on the table below. It is clear that the kiosks made a profit in the quarter, while the stores lost money. Overall, the company’s operating loss dropped by nearly 80%.
| Division | $ Millions Operating Profit / (Loss) | Percent Change Y/Y |
| Fine Jewelry | ($6.3) | vs ($16.6) |
| Kiosks | $7.5 | +47% |
| Other (Mostly Insurance) | $2.0 | +62% |
| Unallocated | ($8.7) | vs ($14.5) |
| TOTAL | ($5.4) | vs ($24.7) |
· Zale opened one kiosk and closed two locations. In addition, it closed 24 fine jewelry stores, mainly Zale and Gordon’s brand. At the end of the quarter, it operated 1,845 units, including 1,173 stores and 673 kiosks. At its peak – October 2006 – Zale operated 2,366 units. Thus, over the past five years, Zale’s total unit count (stores and kiosks) has fallen by nearly 25%, both through divestitures (Bailey Banks & Biddle) and closures (primarily Zale’s and Gordons brands).
Outlook for Zale
Zale management did not provide any significant new guidance for Wall Street shareholders. However, it did reiterate the following outlook which it had previously provided.
· Zale expects that there will be “significant price increases” this summer, broadly across all of its lines, reflecting higher commodity costs.
· Zale expects to close about ten jewelry stores and seven kiosks in the quarter ending July 2011. During the next fiscal year (August 2011-July 2012), the company plans to close about 20 fine jewelry stores and five kiosks. This will bring its store count down to near 1,800 in a year or so.