IDEX Online Research: U.S. Jewelry Sales Show Solid Gain in January
March 25, 12
(IDEX Online News) – Jewelry sales in the
Further, jewelry lost share of wallet in January, another discouraging trend. However, since January is often a slow month for jewelers, we’re not changing our forecasts for jewelry demand for 2012 which call for a six percent sales gain.
Mid-Single Digit Gains in Both Key Distribution Channels
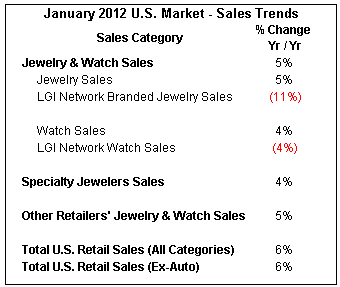
Here’s the preliminary summary jewelry sales report for January 2012:
· Total U.S. Jewelry Sales +4.7 percent
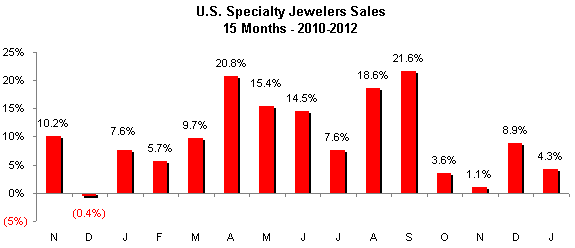
· U.S. Specialty Jewelers’ Sales +4.3 percent
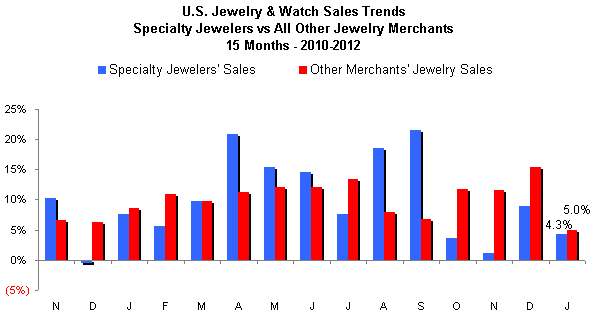
· Jewelry Sales at “Other” Merchants +5.0 percent
Here are some high-level trends that we believe reflect jewelry sales during the month of January 2012:
· Jewelry lost a little market share in January. Total retail sales in the
· Specialty jewelers, with a sales gain of 4.3 percent, lost market share to other merchants – discounters, mass marketers and online sellers – who sell jewelry. These “other” merchants posted a 5.0 percent gain in jewelry sales.
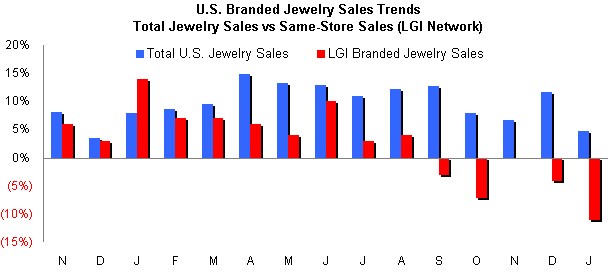
· Total jewelry (ex-watches) sales were up 4.8 percent. Jewelry sales (ex-watches) represented about 87 percent of total jewelry and watch sales, in line with historical levels. Branded jewelry sales declined by a sharp 11 percent in January, according to data from the LGI Network. We believe consumers are telling the industry that “fashion” trumps “brands.”
· Watch sales, which were up 3.9 percent, were softer than total jewelry sales. However, data from the LGI Network reflects a more negative trend: LGI watch sales were down four percent, on a same-store basis during January.
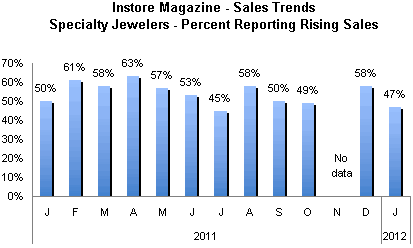
· January’s more modest sales gains were also confirmed by InStore magazine’s Brain Squad: the number of jewelers reporting an increase in sales declined modestly to 47 percent of those reporting, down from the mid-50 percent to low 60 percent range reported for most months of 2011.
The table below summarizes jewelry and watch sales data in the
 Source: US Dept of Commerce $ LGI Networks |
Jewelry Sales Trend Softening
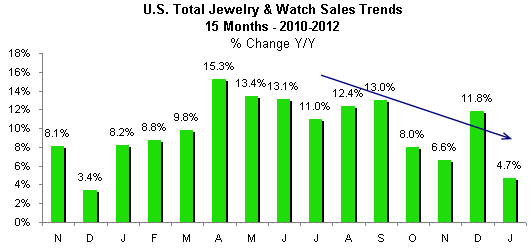
Jewelry sales gains peaked in mid-2011, and have been on a weakening trend since early last fall, as the graph below illustrates. Not only is uncertainty high – due to stubbornly high unemployment levels, uneven economic growth, foreign financial woes, and unstable geopolitical situations – but the vitriol associated with the upcoming 2012 presidential and congressional elections has had an unsettling impact on consumers. These factors have served to cap demand for luxury goods products such as jewelry.
 Source: US Dept of Commerce |
Total Jewelry & Watch Sales Up, But Trends Weaker
Total jewelry and watch sales through all retail outlets rose by 4.7 percent in January. This was the smallest monthly gain in over a year. While January is also the least important month of the year for jewelers, this is a continuation of decelerating sales gains, which have occurred since late last summer.
Total jewelry sales in the
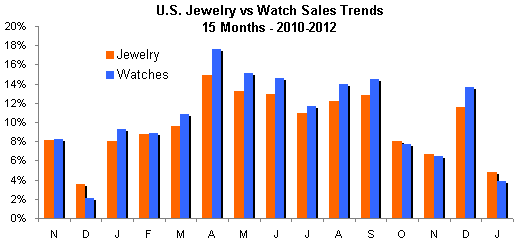
Total jewelry (ex-watches) sales rose by 4.8 percent in January, as the graph below illustrates (red bars). Watch sales increased by 3.9 percent, as reported by the Department of Commerce (blue bars). After lagging in 2010, watch sales gains generally outpaced jewelry sales gains during 2011, but lagged in January.
 Source: US Dept of Commerce |
Watch Sales Up, But Momentum Slowed Further in November
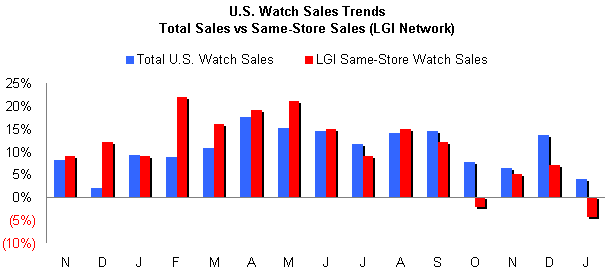
Watch sales in January among jewelers in the LGI Network (an NPD Group company) were down four percent on a same-store sales basis. This reflected a contrarian trend from the watch sales gain reported by the Department of Commerce, as the graph below illustrates. Generally, the LGI data tracks reasonably closely with government sales data. LGI data tracks watch sales through all distribution channels on a same-store basis.
 Source: US Dept of Commerce |
Branded Jewelry Particularly Weak
Sales of branded jewelry, as reported by the LGI Network, have been particularly weak in recent months. During January, branded jewelry sales were down a dramatic 11 percent, according to the LGI Network. This is in contrast to jewelry (ex-watch) sales up 4.8 percent, as reported by the Commerce Department, as the graph below illustrates.
 Source: US Dept of Commerce |
The branded jewelry sales figures are based on the performance of LGI Network's Branded Jewelry Tracker service which currently reports on ten leading jewelry brands including David Yurman, Hearts On Fire, John Hardy, Kwiat, Marco Bicego, Mikimoto, Precision Set, Roberto Coin, Scott Kay and Tacori. The branded jewelry sales trends are derived solely on the per-storefront productivity of independent specialty jewelers only.
Specialty Jewelers’ Sales Reflect Modest Industry Under-Performance
Specialty jewelers’ November sales rose by 4.3 percent, according to data from the U.S. Commerce Department. In contrast, jewelry and watch sales at “other” retailers – largely multi-line discounters – were up 5.0 percent. Historically over the longer term, “other” merchants have been taking market share from specialty jewelers. In 2011, the “market share ball” bounced back and forth all year long; final figures revealed that specialty jewelers lost a little market share to other retail merchants who sell jewelry.
The graph below summarizes sales gains at both specialty jewelers and “other” merchants who sell jewelry.
 Source: US Dept of Commerce |
Specialty jewelers’ sales were an estimated $1.72 billion in January 2012, up from last year’s estimated $1.65 billion, a 4.3 percent sales gain.
The graph below summarizes monthly sales trends for specialty jewelers. As the graph illustrates, specialty jewelers’ sales have been weakening since the third quarter of 2011.
 Source: US Dept of Commerce |
The weaker January sales trends were confirmed by InStore magazine’s Brain Squad report, which showed that just under half of all specialty jewelers in the magazine’s sample reported that their January sales were up. In contrast, a solid majority of specialty jewelers had been reported improved sales for most months in 2011, as the graph below illustrates.
 Source: US Dept of Commerce |
Jewelry Lost “Share of Wallet” in January
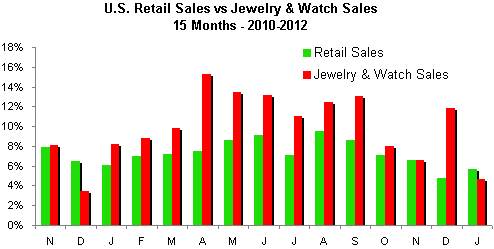
Jewelry and watch sales gains in January of 4.7 percent were below the sales gains for other retail categories. For the month of January, total
Despite nagging high unemployment and a host of other negative factors weighing on American consumers, they are still spending money on retail goods. Last year, one of the beneficiaries of this spendthrift mentality was the
 Source: US Dept of Commerce |
Outlook: 2012 Could Be Subdued
The national and international environment is likely to remain unsettled throughout most of 2012. Saber-rattling, especially in the
While 2011 jewelry sales were up just under 11 percent, we are projecting more modest growth longer term. Long term, our forecast calls for
What worries us the most about making a jewelry sales forecast for 2012? There are an unusually large number of major uncertainties looming both nationally and internationally – as mentioned above. Uncertainty has more of an impact on consumer spending on luxury goods than any other factor.