IDEX Online Research: U.S. Jewelry Sales Continue to Slow in July
September 24, 12
(IDEX Online) – Specialty jewelers in the
Total jewelry sales rose by just under 4 percent in July, somewhat below June’s revised 4 percent gain. These monthly gains were far below last year’s near record growth of 11 percent for the twelve months of 2011, and they illustrate the slowing pace of jewelry industry sales in the American market. Jewelry demand in the
Uncertain American consumers have continued to keep a tight rein on their jewelry spending this year. Unfortunately, shoppers’ uncertainty – and the resulting spending restraint – is not likely to change any time soon. The uncertainties, which won’t be resolved quickly, include the outcome of the presidential election in November, the faltering
There is only one reasonably bright spot: we have not changed our jewelry sales forecast for the full year of 2012 – in the range of a 4 percent gain for the
Highlights: July Jewelry Sales Muted
Consumer demand trends for jewelry in the American market are as follows:
· Retail demand for basic goods and services in July was muted, for both jewelry and all retail merchandise. Consumers kept their purse strings tight during the month. However, when food and automobile sales are included, total
· Fine jewelry and watch sales were stronger than total retail sales (ex-automobiles) as well as total retail sales gains including the highly volatile automobile category.
· Demand for fine jewelry outpaced demand for fine watches. Some of this is related to price inflation of components used in jewelry.
· Specialty jewelers lost market share to multi-line merchants who sell jewelry. July is often a slow month for specialty jewelers, with mall traffic down due to summer vacations.
· Sales of high-end jewelry and watches were weaker than sales of popular-priced merchandise. This is a reversal from the prior month, when high-end jewelry and watch sales were stronger.
· Our jewelry and watch sales forecast remains unchanged, but we are watching consumer demand closely, especially as we move closer to the all-important holiday selling season.
Demand For Jewelry: Sales Slowing
Jewelry sales in the
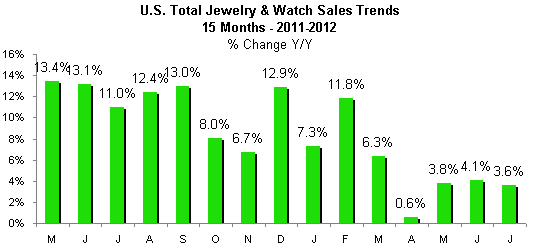
The graph below summarizes total jewelry sales gains by month for the past 15 months.
 Source: US Dept of Commerce |
Detail of Jewelry Sales Trends
July 2012
· Total jewelry sales: $4.9 billion, +3.6 percent
· Specialty jewelers’ sales: $2.0 billion, +0.6 percent
o Specialty jewelers’ sales were 41 percent of total
· Other merchants’ jewelry sales: $2.9 billion, +5.8 percent
o Other merchants’ market share was 59 percent of total
· Total retail sales (all categories): +3.1 percent
o Total retail sales, ex-autos: +1.9 percent
Seven Months Year-to-Date 2012
· Total jewelry sales: $35.7 billion, +5.2 percent
· Specialty jewelers’ sales: $15.4 billion, +4.3 percent
· Other merchants’ jewelry sales: $20.3 billion, +6.0 percent
· Specialty jewelers captured 43 percent of the total jewelry sales in the
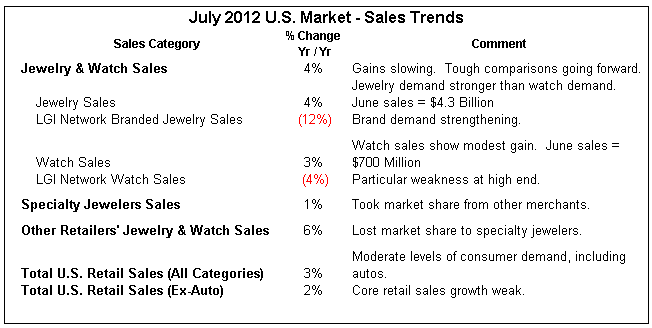
The following table summarizes full data about retail and jewelry sales in July 2012.
 Source: US Dept of Commerce & LGI Group |
What Sold In July: Jewelry Outpaced Watches
Jewelry demand was stronger than demand for fine watches in July, as the following data shows:
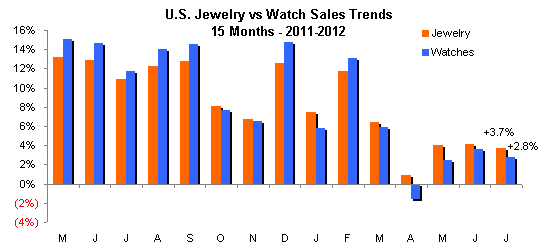
· Fine jewelry sales rose by 3.7 percent to an estimated $4.22 billion in July. Fine jewelry represented about 87 percent of total sales of fine jewelry and watches in July; this was consistent with prior months in 2012 as well as consistent with historic trends.
· Fine watch sales rose by 2.8 percent to an estimate $635 million in July. Fine watch sales were about 13 percent of total sales of fine jewelry and watches in July, which was consistent with prior months in 2012 as well as consistent with historic trends.
During most months in 2011, watch sales showed a greater sales gain than jewelry; this year, jewelry sales gains have been stronger than watches for six of the first seven months.
Branded jewelry sales data from the LGI Network was mixed in July. Demand for branded jewelry above $10,000 was very weak, as was demand in the $1,000-$2,500 range. In other price categories, either demand was about flat or up very modestly.
LGI Network data for watches showed solid consumer demand in the $500 to $1,000 range at retail prices. Demand for popular-priced watches was tepid. Watch sales in the retail price range from $1,000 to $25,000 were soft, but watch demand for goods above $25,000 was solid.
The graph below summarizes sales trends for jewelry (gold bars) and watches (blue bars).
 Source: US Dept of Commerce |
Who Sold Jewelry in July: Specialty Jewelers
Recently, the battle for market share has been bouncing back and forth like a ping pong ball between specialty jewelers and other merchants – mostly multi-line discounters – who sell jewelry. Longer term, however, specialty jewelers have been losing market share.
In July, specialty jewelers lost market share to multi-line retailers by a decisive margin. Shoppers simply were not in the malls. Rather, they were shopping in discount outlets, searching for bargains.
Here’s what the retail distribution channel data shows for jewelry and watches in July:
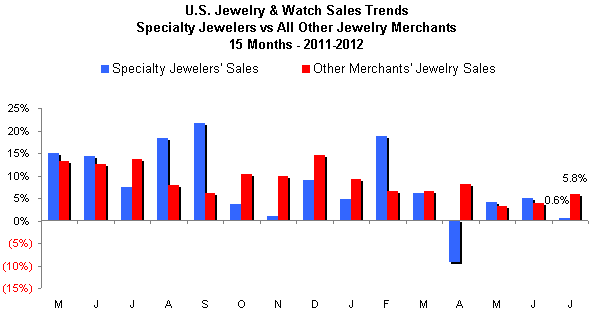
· Specialty jewelers posted a miniscule 0.6 percent gain in sales. This was well below the robust overall 3.6 percent gain for fine jewelry and watches, so specialty jewelers lost market share to other merchants. Specialty jewelers’ sales gains in July were the second weakest of any month this year, but were ahead of the disastrous sales decline in April, when specialty jewelers’ sales fell by over 9 percent.
· Jewelry sales at multi-line merchants such as Wal-Mart, JC Penney, Costco, and others rose by a solid 5.8 percent in July.
The graph below summarizes recent monthly sales trends by major retail distribution channel in the
 Source: US Dept of Commerce |
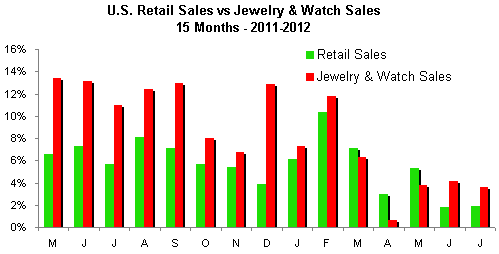
Retail Market Share: Jewelry Gains Outpaced Total Retail Gains
During 2011, jewelry sales gains were much stronger than total retail sales gains (all categories of merchandise), indicating that jewelry captured significantly greater share of wallet during the year.
Beginning in March 2012, jewelry sales were drummed by total retail sales gains, as the jewelry category lost consumers’ share of wallet. This trend continued in April and May. Fortunately, it reversed in June and July. Uncertain consumers typically have uneven spending patterns, and this has been the trend so far in 2012.
· Total jewelry and sales rose by 3.6 percent in July, fueled mostly by jewelry demand.
· Total retail sales, ex-auto, rose by a much more modest 1.9 percent in July. However, when automobile sales – often driven by price-based promotions rather than any underlying need for a new car – are added into the equation, total
The following graph summarizes retail sales trends (green bars) versus jewelry sales trends (red bars).
 Source: US Dept of Commerce |
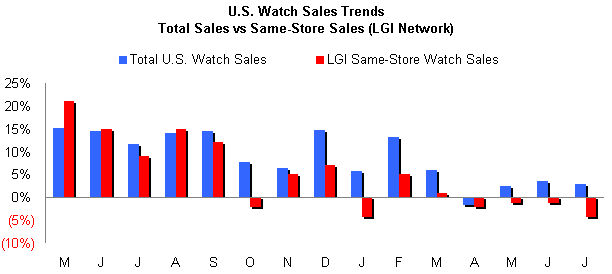
Corroborating Jewelry & Watch Sales Data
Watches – Watch sales data from the LGI Network confirms the same softening trend that the U.S. Department of Commerce is reporting, as the following graph illustrates:
 Source: US Dept of Commerce |
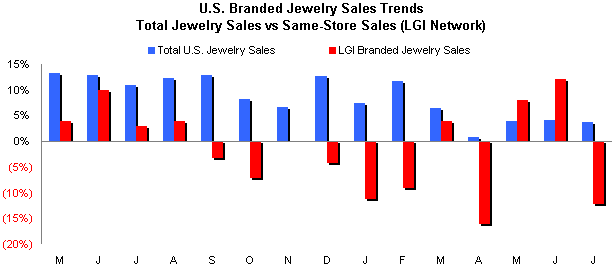
Jewelry – LGI data tracks sales of almost a dozen well-known higher-end brands of jewelry. Hence, it will not necessarily correlate with total jewelry sales. While there have been some sharp swings in demand among the jewelry brands that LGI tracks, the overall trends reflect some weakening in jewelry demand similar to the data reported by the Commerce Department, as the graph below illustrates:
 Source: US Dept of Commerce & LGI Group |
The branded jewelry sales figures are based on the performance of LGI Network's Branded Jewelry Tracker service which currently reports on eleven leading jewelry brands including David Yurman, Hearts On Fire, John Hardy, Kwiat, Marco Bicego, Ippolita Mikimoto, Precision Set, Roberto Coin, Scott Kay and Tacori. The branded jewelry sales trends are derived solely on the per-storefront productivity of independent specialty jewelers only.
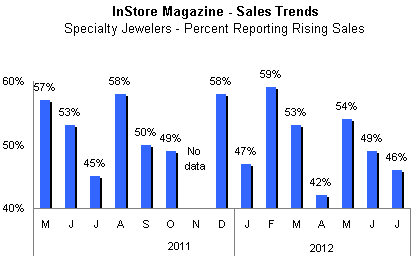
Specialty Jewelers – InStore magazine has a panel of specialty jewelers – called the Brain Squad – which report monthly sales trends. While the sample is large enough to be reasonably accurate, we suspect that jewelers with good news are more likely to report their numbers than jewelers whose performance is lagging. Still, the Brain Squad’s trends reflect a modest weakening in sales trends, though not as great as the Commerce Department data, as the following graph illustrates:
 Source: InStore Magazine |
Outlook: Moderate Gains
Jewelry sales in the
We continue to forecast that sales of fine jewelry and watches will rise by about 4 percent in 2012, when compared to 2011. While the percentage gain is modest, 2012 will be a record year for the American jewelry industry.
A reminder to those who follow IDEX Online Research regularly: U.S. Gross Domestic Product (GDP) trends show the closest correlation to jewelry sales, and no other factor – unemployment, interest rates, savings rate, stock market performance – shows a closer correlation. The oft-quoted consumer confidence indices show almost no correlation – either direct or inverse – to jewelry sales trends, and for this reason we do not report it, nor is it a factor in our forecast equations.