IDEX Online Research: April U.S. Jewelry Sales Show Solid Gains
June 25, 10
The continuing recovery in the American economy is driving solid sales gains for
There were three significant drivers of demand in April, which we have dubbed “The 3 B’s”: Bridal, Beads, and Barter (buying gold). Further, retail jewelers report that sales of fashion goods have shown improvement.
Here’s the scoreboard for April U.S. retail and jewelry sales:
Source: U.S. Department of Commerce *Jewelry sales at all merchants not classified as “specialty jewelers”. Includes Wal-Mart, J.C. Penney, Kohl’s and others |
April Jewelry Sales Highlights
Highlights of April and first fiscal quarter (February, March, and April) jewelry sales include the following:
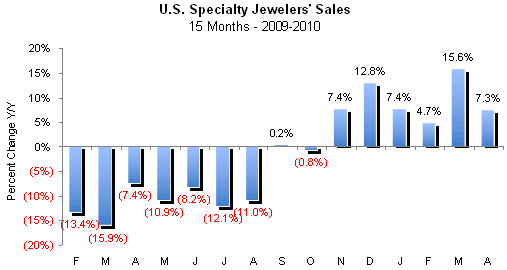
· Specialty jewelers posted a dramatic 7.3 percent gain in sales in April 2010 versus the same month a year ago. This was much more in line with expectations than the unusually strong 15.6 percent gain in the prior month - March (revised downward only modestly from the preliminary +15.7 percent). On the other hand, in periods of recovery, monthly sales comparisons can be volatile.
The graph below summarizes specialty jewelers’ monthly sales gains for the past 15 months. There is significant variation in the monthly sales gains, as the graph illustrates. However, the trend is clear: jewelry sales have risen for the past six months on a year-to-year basis.
 |
· Specialty jewelers’ sales rose by 8.7 percent in the first fiscal quarter of 2010 (February, March, April), a dramatic reversal from last year’s decline of 12.4 percent.
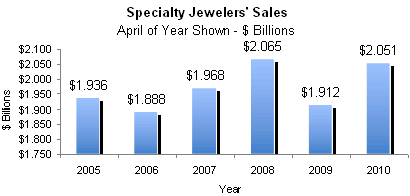
· Specialty jewelers’ sales rose to $2.051 billion in April 2010, well above April 2009’s $1.912 billion, and almost at April 2008’s pre-recession level of $2.065 billion, as the graph below illustrates. Specialty jewelers’ sales represent just under half of total jewelry sales in the
 |
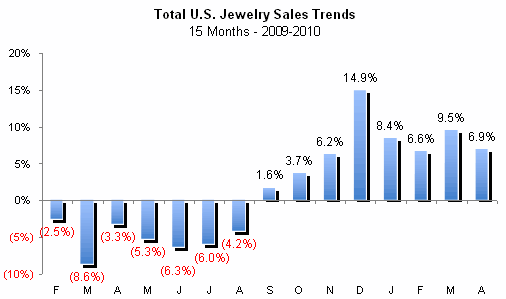
· Total
The graph below summarizes year-to-year changes in total
 |
· The current annual run-rate for total jewelry sales in 2010 is $63 billion. This is well above 2007’s record jewelry sales of $61.6 billion. The annual run rate has been rising modestly each month this year; as new data comes in, government forecasting equations have become more optimistic.
Outlook: Brighter for Jewelry
While the recession brought about some changes in jewelry consumption in the
We’ve been predicting this trend: despite dire reports that consumer spending trends will be forever altered, it simply doesn’t happen that way. Spending trends change very slowly – by evolution, not revolution. Further, the jewelry industry has 50,000 years of history during which demand for jewelry remained undiminished. How many times do we need to say this: The recession of 2008-2009 isn’t going to change consumers’ cultural affinity for jewelry.