Menu Click here
website logo
Sign In| Sign Up
back back
Diamond trading
Search for Diamonds Manage Listings IDEX Onsite
diamond prices
Real Time Prices Diamond Index Price Report
news & research
Newsroom IDEX Research Memo Search News & Archives RSS Feeds
back back
Diamond trading
Search for Diamonds Manage Listings IDEX Onsite
diamond prices
Real Time Prices Diamond Index Price Report
news & research
Newsroom IDEX Research Memo Search News & Archives RSS Feeds
back back
MY IDEX
My Bids & Asks My Purchases My Sales Manage Listings IDEX Onsite Company Information Branches Information Personal Information
Logout
Newsroom Full Article

IDEX Online Research: Global Economic Growth Momentum Turns Positive

February 23, 12 by Ken Gassman

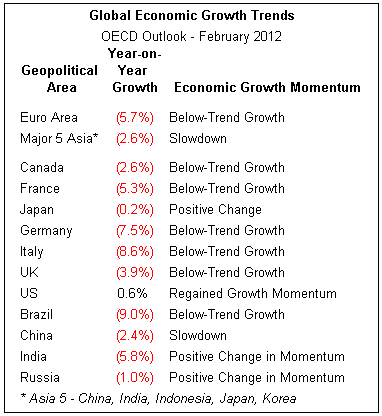
(IDEX Online News) – Composite Leading Economic Indicators (CLI) in February points to a positive change in momentum for major geopolitical entities, according to the OECD. Previously, there has been little overall change in the Composite Leading Indicators, most of which were in negative territory.


The Composite Leading Indicators’ positive momentum is being driven primarily by the United States and Japan, with similar signs emerging in a number of other developed economies. The CLI’s for India and Russia are also showing signs of an upward change in growth momentum. This is good news for the global diamond industry.


Unfortunately, the Composite Leading Indicators for the Euro Area and Brazil continue to point to below-trend growth. However, tentative signs are emerging that the recent deterioration in CLI’s is moderating in Europe. In fact, the CLI’s for seven of the fifteen countries in the Euro Area are now pointing towards a positive change in momentum. The only major geopolitical area to show marked deterioration in its Composite Leading Indicators is China, where signs point more strongly to a potential economic slowdown.


The following table summarizes the economic growth cycle outlook for some key diamond consuming nations around the world as well as other nations whose demand helps drive growth for the global jewelry industry.

Source: OECD

 U.S. “Unemployment” Level Does Not Tell the Full Story

The politicians in Washington are heralding the latest unemployment data in the U.S. market: it shows that unemployment is down. Those politicians claim that more than nine in ten Americans are gainfully employed.


However, an analysis of the data, while showing some improvement, masks some underlying trends.


Here is the full story:


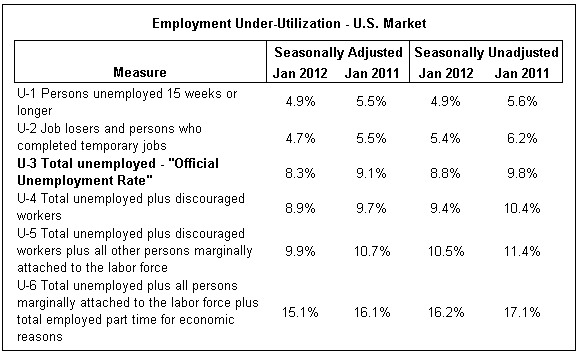
·        8.3 percent – This is the number that the media publishes when reporting unemployment, and that is the number the politicians watch. For economists, this is just one number – dubbed U-3 – that is used to measure economic vitality. This number is the “total unemployed, as a percent of the civilian labor force.” One year ago, the “official unemployment level” in the U.S. was 9.1 percent; it peaked at just under 10 percent in the recent recessionary cycle. So, clearly, progress has been positive. In the best of times, the figure should be at 5 percent or less; this is considered “full employment” by most economists.

Approximately 10.5 percent of all Hispanic workers are unemployed, while 13.6 percent of all Blacks are unemployed. About 7.4 percent of all White workers are unemployed. Based on the demographics of the typical jewelry shopper in the U.S., White shoppers are by far the most lucrative target for jewelry merchants: they spend far more per household on jewelry than any other ethnicity.

The three largest occupations with double-digit unemployment are construction, leisure and hospitality, and agriculture workers. All other occupations have single-digit unemployment levels.

During 2011, 13.7 million people in the U.S. were unemployed. The current level of employment is just over 63 percent of all adults in the U.S., down just under 4 percentage points from historic levels of “full employment.”


·        15.1 percent – This number, known as U-6, represents the “total unemployed plus all persons marginally attached to the labor force, plus total employed part time for economic reasons.” In short, this includes unemployed and under-employed workers. It was 16.1 percent a year ago; it has shown improvement, but not by much.


·        9.9 percent – This number, known as U-5, represents “total unemployed plus discouraged workers plus all other persons marginally attached to the labor force.” A year ago, it stood at 10.7 percent.


·        4.9 percent – This number, known as U-1, is the number of people “unemployed 15 weeks or longer, as a percentage of the civilian labor force.” It stood at 5.5 percent a year ago.


The table below summarizes the six key measures of unemployment in the U.S. market. 

Source: BLS

Definitions: Persons marginally attached to the labor force are those who currently are neither
working nor looking for work but indicate that they want and are available for a job and have looked
for work sometime in the past twelve months. Discouraged workers, a subset of the marginally
attached, have given a job-market related reason for not currently looking for work.
Persons employed part time for economic reasons are those who want and are available for
full-time work but have had to settle for a part-time work schedule.

Diamond Index
Related Articles

IDEX Online Research: Global Economic Growth Continues To Slow

January 25, 12 by Ken Gassman

Read More...

Newsletter

The Newsletter offers a quick summary of the past week's industry news and full articles.
Our Services About IDEX Privacy & Security Terms & Conditions Sign-Up Advertise on IDEX Industry Links Contact Us
IDEX on Facebook IDEX on LinkedIn IDEX on Twitter