IDEX Online Research: Jewelry Executives’ Compensation Reasonable
March 31, 07
By Ken Gassman
Chief executive officers (CEOs) of publicly held jewelry companies appear to be fairly compensated – based on a comparison of executive pay in other retail categories. Jewelry executives’ salaries are moderate, and there is ample upside compensation potential via incentive programs. In addition, severance packages for jewelry industry executives appear to be reasonable, without being excessive. These are the major conclusions reached in an exclusive Executive Salary Study conducted by IDEX Online Research.
With executive pay packages squarely in the gun sights of regulators and social activists, IDEX Online Research examined the pay packages of the top five highest-paid officers of each major publicly held jewelry company – retailers, suppliers, and online merchants. While watchdog organizations claim that corporate executive pay is far too lavish, IDEX Online Research does not believe this to be true in the jewelry industry.
IDEX Online Research compared compensation of jewelry executives to several financial benchmarks – sales and profitability levels; growth of sales, profits, and the value of the company’s shares; as well as other benchmarks. In addition, executive compensation of jewelry executives was compared to executives in other retail categories. The highlights of the study are summarized below.

Compensation levels for jewelry industry executives vary widely. Further, compensation varies significantly from year to year, based primarily on incentive compensation.
Because executive compensation is an art, it is difficult to use one or even several benchmarks to measure and compare how companies’ top officers are compensated. Furthermore, not all executive compensation is reported – and certainly not on a basis that allows easy comparison. That should change, however, based on new Securities and Exchange Commission rules, which were implemented in mid-2006.
EXECUTIVE COMPENSATION: JEWELRY CEOS
Call them what you want – chairman, chief executive officer, president, big kahoona – they are the top executive in an organization. As former U.S. President Harry Truman said, “The buck stops here.”
Executive compensation plans for CEOs are particularly complex, with many moving parts. Most SEC documents filed by public companies outline executive pay programs, but few give any details about how executive performance is actually measured. Thus, our analysis is purely quantitative, based on financial benchmarks that we used during our Wall Street career. We readily acknowledge that there are qualitative issues involved with executive performance measures, but those are beyond the scope of this analysis.
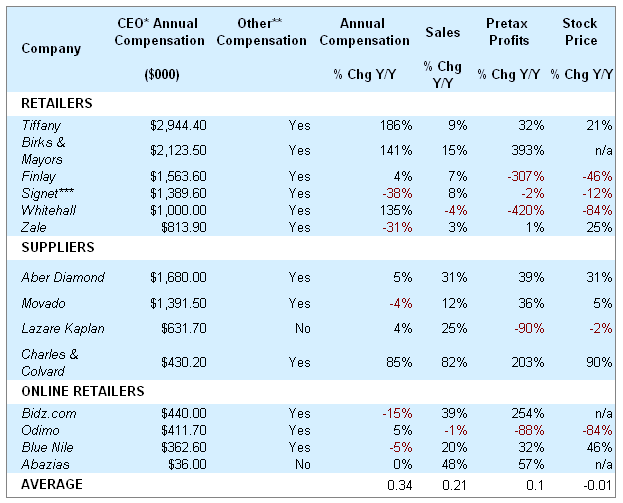
The following table summarizes compensation levels in 2005 for jewelry industry executives, along with financial benchmarks for the time period that coincides with their compensation period. For example, Signet Group’s fiscal year runs from February to January; sales were summarized for the same period, as was a comparison of the price of the company’s shares.
| Jewelry Industry CEO Compensation - 2005 |
It is easy to argue that these financial benchmarks are too rigid. However, in lieu of other benchmarks, which are not disclosed to public shareholders (though this will change in 2007), these high level financial measures shown on our table provide a reasonable method of evaluating an executive’s performance.
Here is an explanation of the columns on the table:
- Annual compensation – Salary, bonus, and other annual compensation, excluding long term incentives such as stock options and benefits.
- Other Compensation – This includes stock options and other long term benefits. Some companies put a value on these; others do not. Under new SEC rules, companies will be required to spell out all compensation, including the value of club memberships, corporate airplane usage, and other “stealth” executive perks.
- Year-to-Year Percentage Change – Each financial benchmark – compensation, sales, pretax profits, and stock price – was compared year-over-year, with the result being “percent change year-to-year.” All comparisons represent fiscal periods, not calendar periods. For example, we compared the average price of Signet Group shares (SIG-NYSE) during January 2006 versus January 2005. Executive compensation committees may use different periods and different measures, but the concept we used for analysis is sound and reasonable.
- Tiffany – Total annual compensation for Tiffany’s CEO rose by 186 percent in 2005 due to a bonus of nearly $1.8 million versus no bonus in 2004.
- Birks & Mayor – The CEO of Birks & Mayor received a bonus of $1.1 million in 2005 versus a $367,000 bonus in the prior year.
- Signet Group – The CEO of Signet did not get a bonus in 2005. In the prior year, he received a bonus of just over $900,000.
- Whitehall – Whitehall was trying to fashion a pay package that would entice someone to lead this wounded company back to prosperity. As a result, executive compensation levels varied widely in the study period.
- Zale – A large bonus in 2004 versus a small bonus in 2005 made a significant difference in the CEO’s annual compensation.
- Charles & Colvard – A large bonus made a substantial difference in the compensation package for Charles & Colvard’s CEO.
- Lazare Kaplan & Abazias – Neither company granted “other compensation” – options – to its top officers in 2005. Options have been granted in prior years.
Under then-current SEC rules in 2005, companies were not required to put a value on long term compensation. Therefore, IDEX Online Research was unable to include the value of these benefits in examining the total pay package of all jewelry executives. When companies did disclose the value of these long-term compensation packages, they ranged from a mere pittance to 100 percent (or more) of total annual compensation. For example, in 2004, the CEO of Aber Diamond received a salary and bonus of $1.6 million; he also received an option package valued at $1.6 million. However, in 2005, he received no options, but did receive “other compensation” of $50,986.
The full analysis of the Executive Compensation study contains the following major headings:
Executive Compensation: Salary vs. Bonus Mix
Executive Compensation: Tied to Profits?
Executive Compensation: Jewelry Executives’ Pay is Reasonable vs. Other Retail Categories
Executive Compensation: Severance Payments
Executive Compensation: Zale Corporation
Executive Compensation: Test for Social Correctness
Executive Compensation: Other Top Officers
Executive Compensation: Motivating the Top Brass
Executive Compensation: Increased Disclosure
For the full research report and analysis, go to: http://www.idexonline.com/Research/JewelryExe