IDEX Online Research: It’s All About Money - Consumer Jewelry Expenditures by Income
August 12, 07
They say money can’t buy happiness, but it can buy jewelry, and that’s pretty close to happiness for many consumers. Once again, the latest data from the U.S. Bureau of Labor Statistics’ Consumer Expenditure Survey confirms that income levels are the single demographic factor with the highest correlation to jewelry expenditures.
It should come as no surprise that the wealthiest, highest-income Americans spend disproportionately more on jewelry than lower income consumers. However, if there is a surprise, it is just how much more the high income consumers spend. Jewelry expenditures of households with the highest income levels - $70,000 and above – spend more than three times the level of the next highest income level – $50,000 to $70,000. The average household with annual income of $70,000 and greater spends just over $1,200 on jewelry each year, while households with $50,000 to $70,000 income spend just under $350 annually on jewelry.
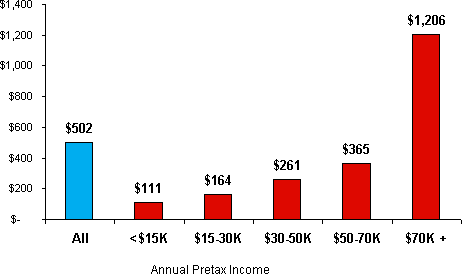
The graph below summarizes jewelry expenditures by income levels for 2005.
| Annual Jewelry Expenditures Per Household |
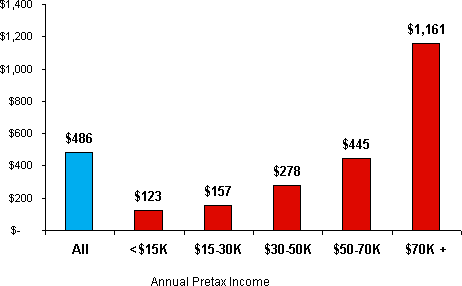
When jewelry expenditures by income level for 2004 are compared with the most recent data for 2005, the same underlying trends are evident: those with the money spend it on jewelry.
| Annual Jewelry Expenditures Per Household |
High-Income Households = High Jewelry Expenditures
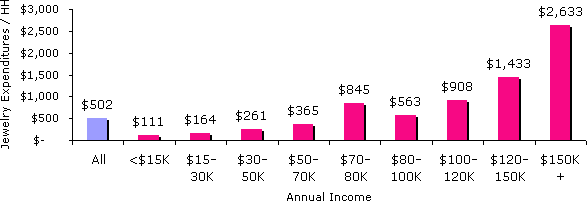
Jewelry expenditures really soar, when analyzing “high-income households” which are a subset of all households with annual income above $70,000. These high-income households represent about 28 percent of all American households. For example, households with annual income of $150,000 and higher, which represent 6 percent of all U.S. households, spend over $2,600 annually on jewelry. That spending represents about 28 percent of the aggregate total of all jewelry expenditures in a year in the U.S.
The graph below summarizes jewelry expenditures by household for differing income levels. Clearly, the higher the income, the more the household will spend on jewelry.
Annual Jewelry Expenditures Per Household By Income Level - 2005
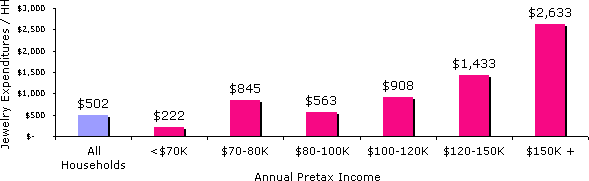
Source: BLS CES
The following graph combines expenditures by income level beginning with the lowest income levels to the very top of the high income households.
| Annual Jewelry Expenditures Per Household By Income Level - 2005 |
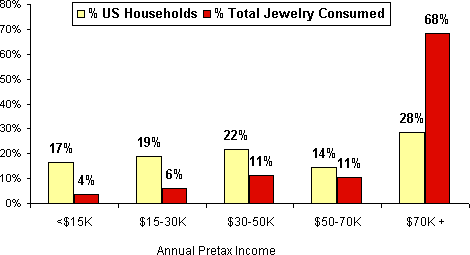
High-Income Households Buy a Disproportionate Amount of Jewelry
Jewelry expenditures by high-income households comes very close to illustrating the “80 / 20” rule which says that 20 percent of your merchandise generates 80 percent of your sales.
In the case of jewelry, 28 percent of the households generate 68 percent of total industry sales, as illustrated on the graph below.
| U.S. Households - Proportion of Jewelry Consumed |