IDEX Online Research: It Comes Down to Annual Income, Not Color of the Collar - Consumer Jewelry Expenditures by Profession
August 15, 07
There is little correlation between white-collar workers’ spending on jewelry versus blue-collar workers’ jewelry expenditures. Whether the collar is white or blue, the correlation – 97 percent to be exact – is between the annual income level of various workers and their spending on jewelry. Once again, it is all about money: those who work in high-income occupations spend much more heavily on jewelry than their less well-paid counterparts.
The lesson for jewelers: if they come into your store in bib overalls or pin-stripe suits, they could be ready, willing and able to spend lots on jewelry. Don’t judge a shopper by the color of his collar.
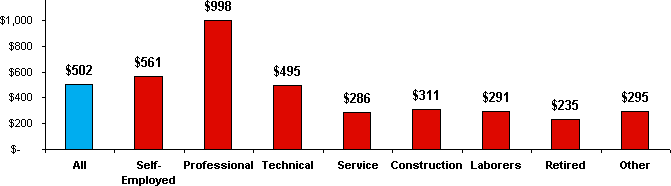
The graph below summarizes jewelry expenditures by household for various professions for the year 2005.
| Annual Household Jewelry Expenditures by Occupation - 2005 |
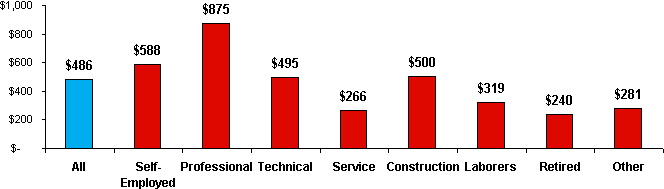
On a year-to-year basis, the results for 2005 were not very different than the results for 2004, as the graph below illustrates. We note, however, that construction workers seemed to spend less in 2005; this may be a sampling anomaly.
| Annual Household Jewelry Expenditures by Occupation - 2004 |
Income Explains Spending Differences
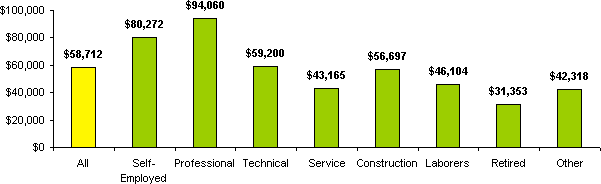
It all comes down to money: those with the money spend it on jewelry. The following graph summarizes pretax income for each profession listed on the graphs above. The correlation between income, profession and jewelry spending is clear.
| Annual Income by Occupation |
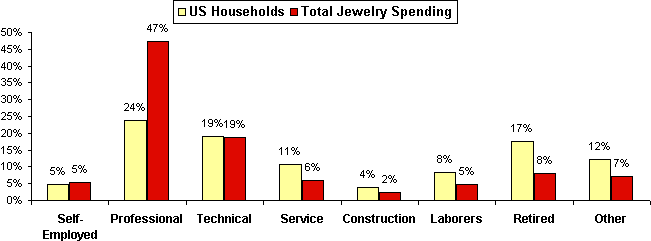
Even more striking is the proportion of aggregate spending by each profession. For example, roughly one-fourth of all American households are headed by a “professional” manager; these households account for nearly one-half of the total jewelry expenditures in the U.S.
The graph below summarizes the relationship between the total households in the U.S. and their aggregate spending power.
| U.S. Households - Proportion of Jewelry Consumption by Occupation - 2005 |