IDEX Online Research: U.S. Jewelry Sales Softens, But Still Relatively Strong in August
October 22, 08
While total U.S. retail sales slowed dramatically in August, jewelry sales held up well. For the month, total jewelry sales in the U.S. market rose by over 2 percent; specialty jewelers’ sales were up by more than 3 percent. Despite pressures on consumer spending, we consider August jewelry demand to be remarkable.
The table below summarizes August jewelry sales as well as total retail sales (all categories) in the U.S. market. Sales data are measured as “dollars through the cash register” and are not seasonally adjusted nor have they been adjusted for inflation.
August 2008 – Monthly Sales Trends
- +2.4 percent - Total U.S. Jewelry Sales
- +3.2 percent - Total U.S. Specialty Jewelers’ Sales
- (0.4 percent) - Total U.S. Retail Sales (All Categories)
- +3.8 percent - Total U.S. Retail Sales (Ex-Auto & Food)
These numbers represent a gradual weakening of both retail demand and jewelry demand that the U.S. market has experienced over the past several months. The table below summarizes key sales trends for the prior three months.
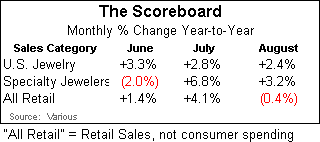
As expected, specialty jewelers’ sales from July were revised downward from the preliminary gain of 7.1 percent to a gain of 6.8 percent; however, we continue to believe that the gain in jewelry sales during August (based on the preliminary government data) may not reflect reality for the majority of specialty jewelers.
What is behind the volatility of the jewelry sales numbers? Why are they softening? In our opinion, there are several factors:
- The U.S. economy appears to be in a slowdown, according to a majority of economists. Unfortunately, many of the numbers don’t support this argument. The U.S. Gross Domestic Product was up by 3.3 percent in the quarter ended June; that’s barely below the average of +3.4 percent since the 1930s. However, unemployment has begun to rise, and there are other factors that appear to be causing consumers, businesses and governments to curtail their spending.
- There has been a credit crunch. For a few weeks, credit was difficult to obtain. However, the government has essentially federalized the credit process. Consumers who want a new home now have access to mortgages at attractive rates; banks have ample money for consumer loans, including credit for shoppers buying jewelry on the monthly payment plan. However, it will take several months for the banking system to unfreeze.
- The stock market has been volatile. With the recent decline in the stock market, consumers simply don’t feel as wealthy. When shoppers don’t feel wealthy, they don’t spend as much.
- Home prices have fallen in many markets. Consumers’ homes are typically the largest asset on their personal balance sheet. Further, the market for home sales has slowed, reducing the ability to create immediate liquidity. These factors – lower home prices and lack of liquidity – have put a crimp in consumer spending.
- Homes are no longer an ATM machine. Over the past few years, some homeowners have used the run-up in equity in their homes to finance their spending habits. With home prices under pressure, there is no new equity which can be converted to cash to cover expenditures for goods and services.
- The media knows “fear” sells, and it is using fear to maximize readership and viewership. The media has labeled many things fearful: the economy, the stock market, the job market, the housing market, credit availability. If we believe the media, economic activity in the U.S. is about to come to an abrupt halt. The only problem with the media is that they often (no exaggeration) get the facts wrong. Just because you see a number or a statement in print, it is not necessarily true. Whether it is due to carelessness or laziness by news writers, readers and viewers should ask themselves if the facts “ring” true, or if those “facts” are just another case of incorrect information.
- There is no compelling reason to buy jewelry. We have blamed consumer electronics for siphoning off discretionary spending which might have been allocated for jewelry. Consumer electronics producers continue to flood the market with new exciting products; jewelers have nothing new to offer shoppers.
Jewelry Sales Forecast Revised Downward
Based on all of the forces which are bringing pressure on the consumer sector of the economy, we are revising our jewelry sales forecast for the U.S. market in 2008 to about +2.0 percent. Previously, we were forecasting sales to be in the range of +2.8 percent to 3.0 percent.
August Jewelry Sales Show Moderate Gain
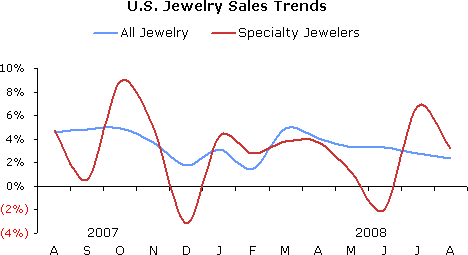
The total market for jewelry in the U.S. grew by 2.4 percent rate during August. That’s not a bad, but the trend is negative (see blue line on the graph below).
Specialty jewelers posted a notable sales gain of 3.2 percent for the month. The only really good news: these figures confirm that specialty jewelers gained market share in August versus their competition from non-traditional sources of jewelry such as discounters, mass marketers, and others.
This statistic reveals which segment of the market is spending: higher income consumers who have discretionary income. Many mass market consumers – who typically buy their jewelry at mass merchants and discounters – are not in the market now.
The jewelry industry gained market share when compared to all retail categories. Total retail sales (all goods, including food and automobiles) posted a very modest 0.4 percent decline in August, dragged down by very weak auto sales.
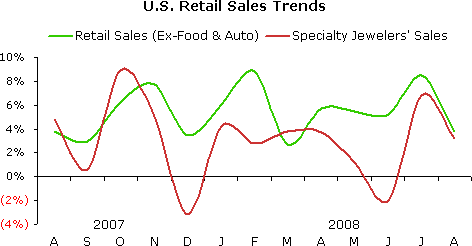
Total retail sales, excluding food and automobiles, were up by a relatively solid 3.8 percent in August. Thus, when compared to most retail categories, except food and automobiles, the jewelry industry – and specialty jewelers – lost a modest amount of market share during the month.
Source: US Dept. of Commerce
The graph below compares specialty jewelers’ sales trends to total jewelry sales trends in the U.S. market. As the graph clearly illustrates, jewelry sales at specialty jewelers have been on a roller coaster ride for the past few months.
July sales for specialty jewelers rose significantly; we believe this is an aberration, and continue to look for further revisions over the next few months.
The graph below summarizes sales trends for all retail goods excluding food and automobiles versus specialty jewelers’ sales. When food and auto sales are excluded, the remaining retail categories posted a sales gain of 3.8 percent in August. When food and auto sales are included, retail sales were down 0.4 percent for the month, as previously indicated.
Why do we eliminate “automobile” sales? Monthly auto sales are driven largely by consumer incentives rather than by underlying economic factors. Over the long term, auto demand trends are an important indicator of consumer vitality; however, on a month-to-month basis, auto demand is dependent on manufacturers’ incentives such as zero percent financing, cash-back offers and other deals. Food sales are far less cyclical and can mask changes in consumer demand; thus, we eliminate them, too.
Source: US Dept. of Commerce
Consumer Spending Slows in August
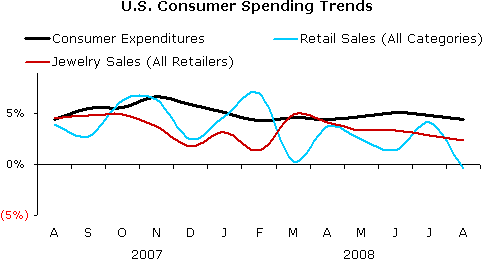
As inflation has slowed, growth of consumer expenditures has slowed from the first half of 2008. During August, consumer expenditures for all goods and services rose by 4.4 percent over the prior year. This represents a steady decline since June’s 5.1 percent gain, a point when the fires of inflation were most threatening.
What is driving the slowing of consumer expenditure growth? As the graph below shows, total retail sales growth took a dive in August, with spending on big ticket durables – often financed on credit – suffering the most. Consumer expenditures on services remain more-or-less on track, with little monthly deviation.
The graph below summarizes trends in American’s total spending, retail sales of all goods and expenditures on jewelry. It is clear that dismal automobile sales in the U.S. market are having a dramatic negative impact on total retail sales.
Automobile sales in 2007 were just over 20 percent of total retail sales; thus, it is clear why they have such an impact on total retail sales trends. And, it should be obvious why we typically eliminate them, when we analyze U.S. retail sales.
Source: US Dept. of Commerce
How Much Are Americans Spending?
Recently, the media reported that Americans had almost stopped spending. Nothing could be further from the truth. The statement “Americans have almost stopped spending” is wrong, it is irresponsible and it reflects the abysmal state of the journalism industry in the U.S.
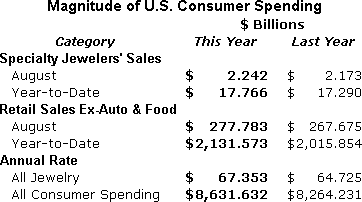
The table below illustrates the magnitude of consumer spending in the U.S. Consumers are on track to spend just over $8.6 trillion dollars this year, up from last year’s $8.3 trillion, according to current projections by the U.S. Department of Commerce (see ‘Annual Rate’ on the table below). In the jewelry sector, the Commerce Department data shows that consumer expenditures on jewelry are running at an annual rate of $67.3 billion, a 4.1 percent increase over the prior year. We believe this annual expenditure rate will slow later this year.
Further, so far this year, American consumers have spent $17.766 billion on jewelry, up 2.8 percent over the first eight months of 2007.
For total retail sales, except autos and food, consumers have spent year-to-date $2.1 trillion versus $2.0 trillion for the first eight months of 2007.
In our opinion, none of these comparisons supports statements that “Americans have almost stopped spending.”
Source: US Dept. of Commerce
Jewelry Sales Forecast Revised Downward
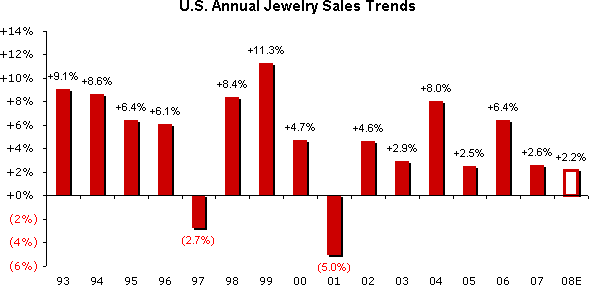
Because of strengthening headwinds, especially in the consumer sector of the economy, we have revised our prediction for jewelry demand in the U.S. market. Previously, we were looking for growth in the range of 2.8 percent to 3.0 percent for the full year. We now believe that a gain in the 2.0-2.2 percent range is more realistic.
It is important for jewelers to understand that this gain is based on “dollars through the cash register” at the retail level. When jewelry price inflation is removed, jewelry sales in terms of units will likely be down about 4-5 percent for the full year.
How bad is a 5 percent decline in sales? It’s not so bad if you think of it in these terms: you’ll still have 95 percent of your sales for the year. So, how do you look at it: is the glass half full or half empty? Are you part of the problem or part of the solution?
The graph below summarizes jewelry sales trends for the past 15 years in the U.S. market. It also shows our new forecast for the full year (far right open red bar).
Source: US Dept. of Commerce & IDEX Online